
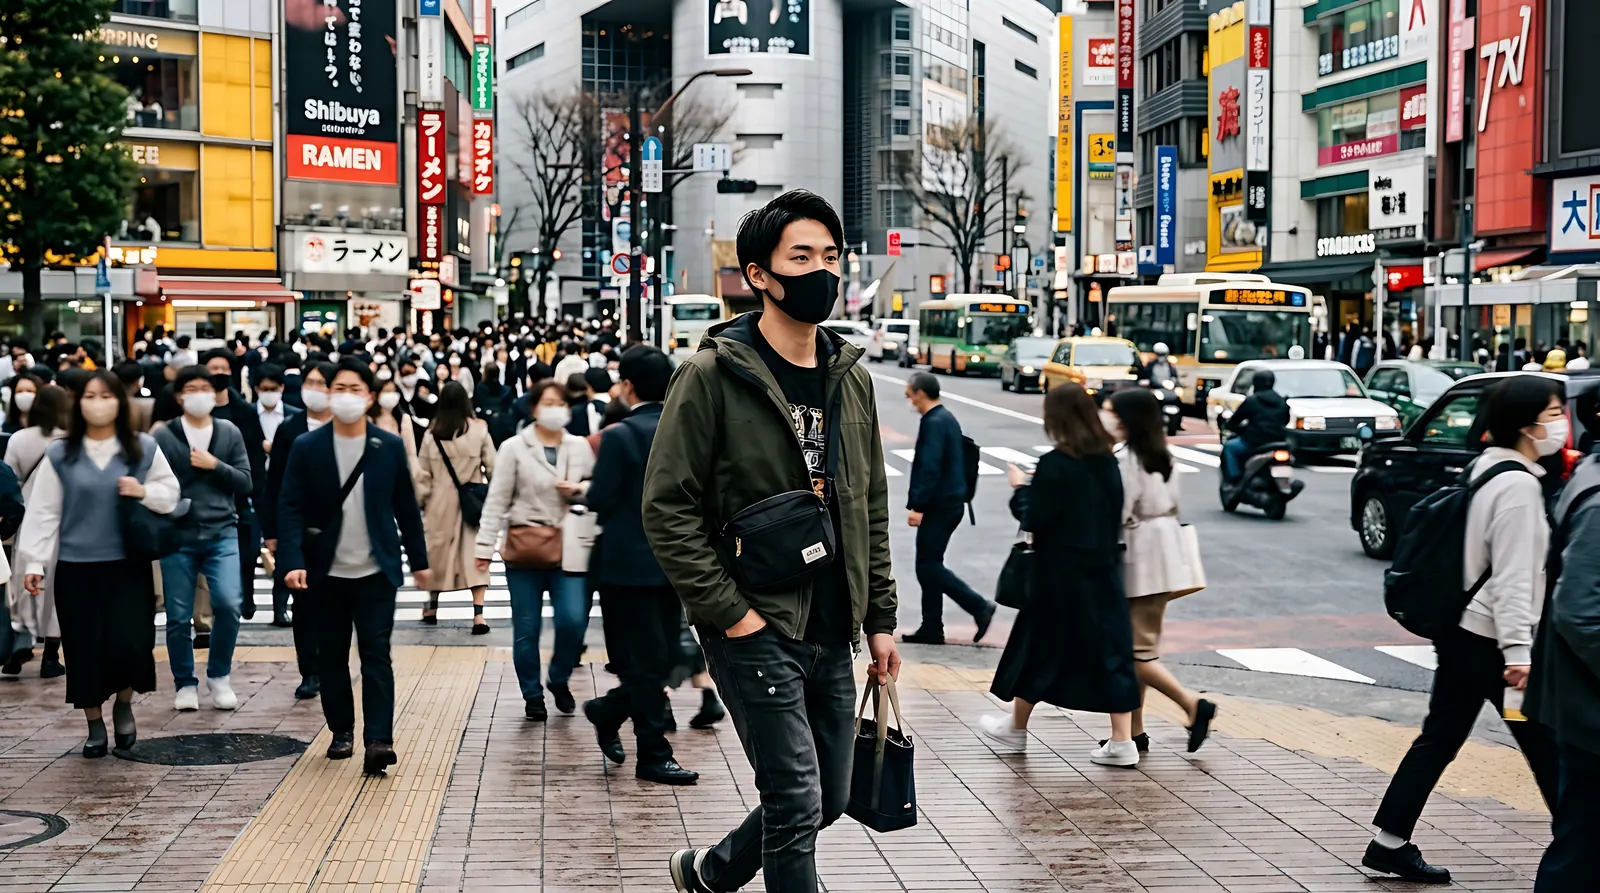
Explera DMC Japan reads the new spending data as a sign that demand stays firm. Visitors spent ¥2.2076 trillion in Japan in July–September 2026, up 3.2% on a year earlier, according to the Japan Tourism Agency's first estimate. Spending per visitor rose 6.1% to about ¥234,000, even though arrivals so far this year are lower.
The figures were published on 21 October 2026. Taiwan was the largest market by spending, and Korea grew the fastest.
What do the figures show?
- Total spending up 3.2%. ¥2.2076 trillion in July–September 2026. This is a first estimate and may be revised.
- More spent per visitor. Spending per visitor rose 6.1% to about ¥234,000.
- Taiwan first. Taiwan spent ¥381.8 billion, 17.3% of the total, up 26.2%.
- China second, but down. China spent ¥358.3 billion, down 39.8%.
- Korea grew fastest. Korea spent ¥293.8 billion, up 45.8%. The United States and Hong Kong were fourth and fifth.
- The year so far. From January to September, spending reached a record ¥7.0574 trillion, up 1.9%, while arrivals were 2.9% lower.
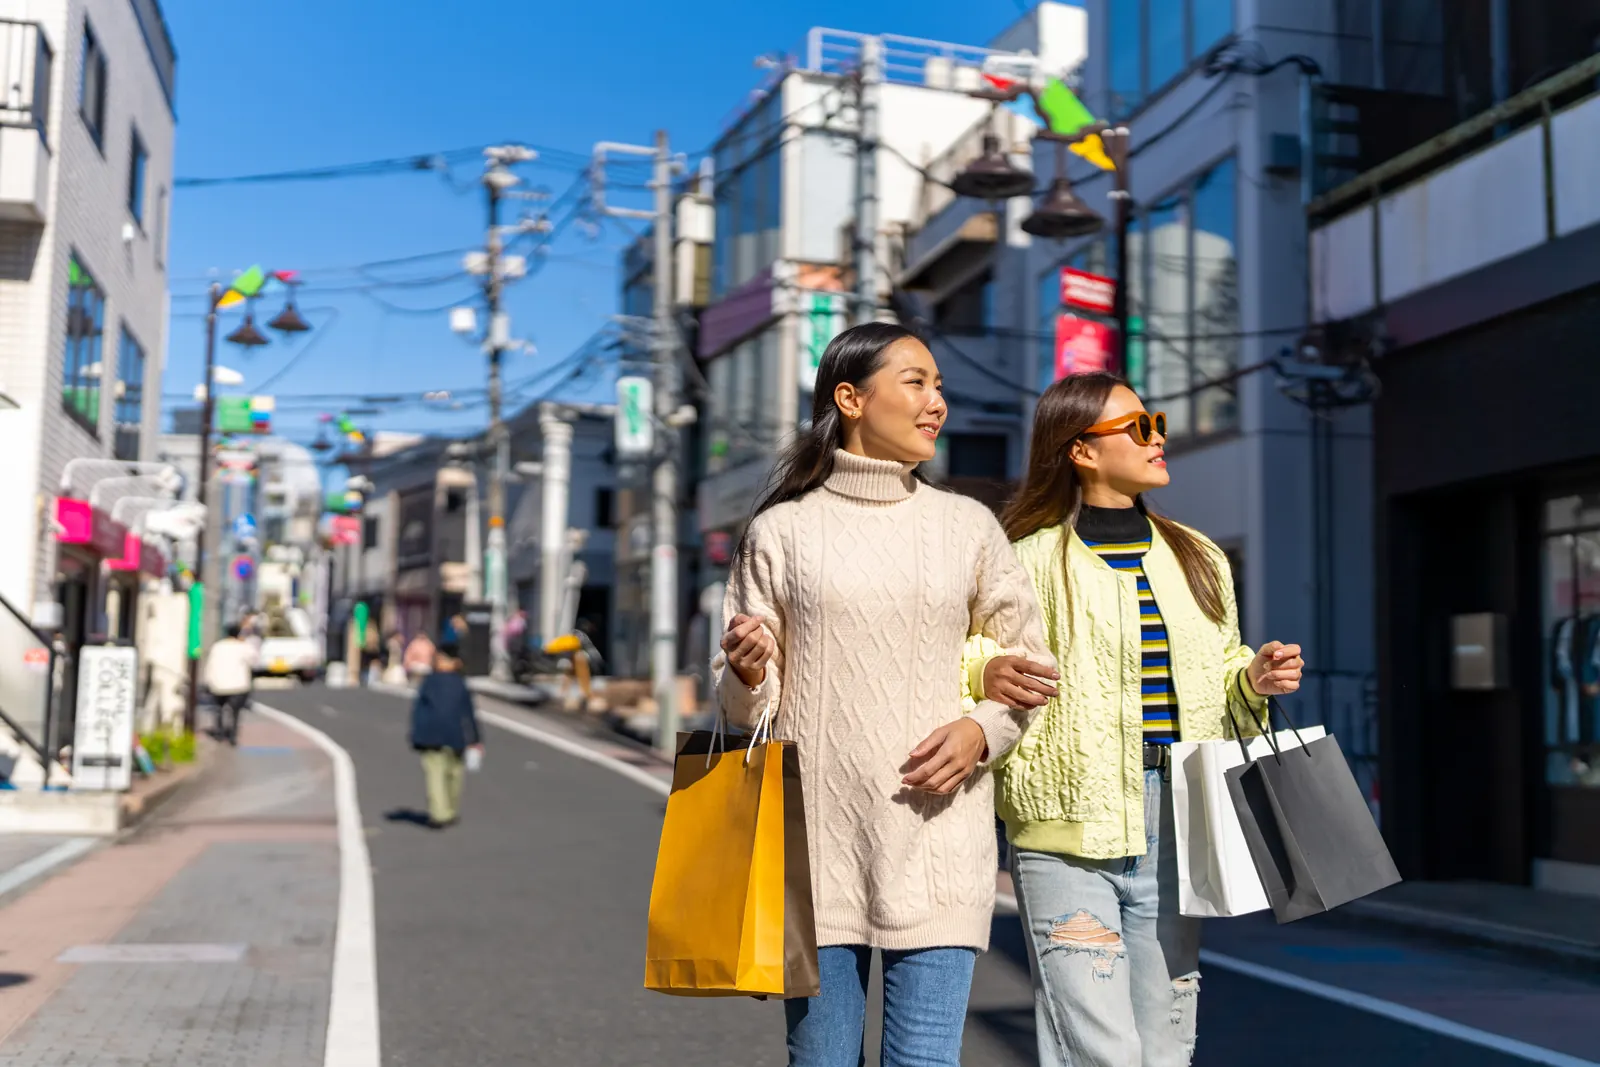
What does it mean for agents?
- Do not expect empty hotels. Fewer arrivals from China may not free much space, because other markets are growing and visitors spend more.
- Book early for peak weeks. Cherry blossom, Golden Week and the autumn leaf season stay the hardest weeks to book.
- Watch the source mix. Strong demand from Taiwan and Korea fills short-haul flights and hotels in Tokyo, Osaka, Fukuoka and Hokkaido.
- Check the final numbers. We use the revised figures when the agency publishes them, and say which estimate we quote.
See our guides to the August 2026 arrivals mix, the Korean market and the Taiwan and Hong Kong markets.
Sources: Japan Tourism Agency: Inbound spending survey, July–September 2026, first estimate (Japanese) and Japan Tourism Agency: Inbound spending survey (Japanese).
FAQ
How much did visitors spend in Japan in July–September 2026? ¥2.2076 trillion, up 3.2% on a year earlier, according to the Japan Tourism Agency's first estimate published on 21 October 2026.
Which market spent the most? Taiwan, with ¥381.8 billion, or 17.3% of the total. China was second and Korea third.
Why did spending rise when arrivals were lower? Spending per visitor rose 6.1% to about ¥234,000, and markets such as Taiwan and Korea grew strongly.
Will these figures change? They may. This is a first estimate, and the agency publishes revised figures later.
Planning a Japan programme for 2027? Write to b2b@explera.jp, message the trade desk on WhatsApp at +66 93 656 8090, or register on the B2B portal. Proposals within 24 hours. IATA TIDS 96215733, ASTA member 900408341.